EV INFOGRAPHIC
An infographic created using Adobe Illustrator and ArcGIS Pro on the state of electric vehicles in America in 2020.
An infographic created using Adobe Illustrator and ArcGIS Pro on the state of electric vehicles in America in 2020.
An ESRI Story Map based on a riparian forest restoration project near Moorhead, MN.
A shaded-relief terrain map developed in Photoshop and ArcGIS Pro.
A Mapbox Studio tileset designed to be used in the next big Star Trek blockbuster. #goals
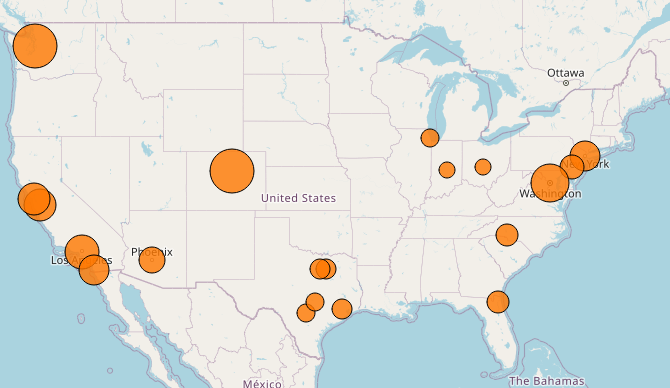
An interactive time series map showing the rates of homelessness in the biggest 20 cities in the U.S. from 2010 to 2019.
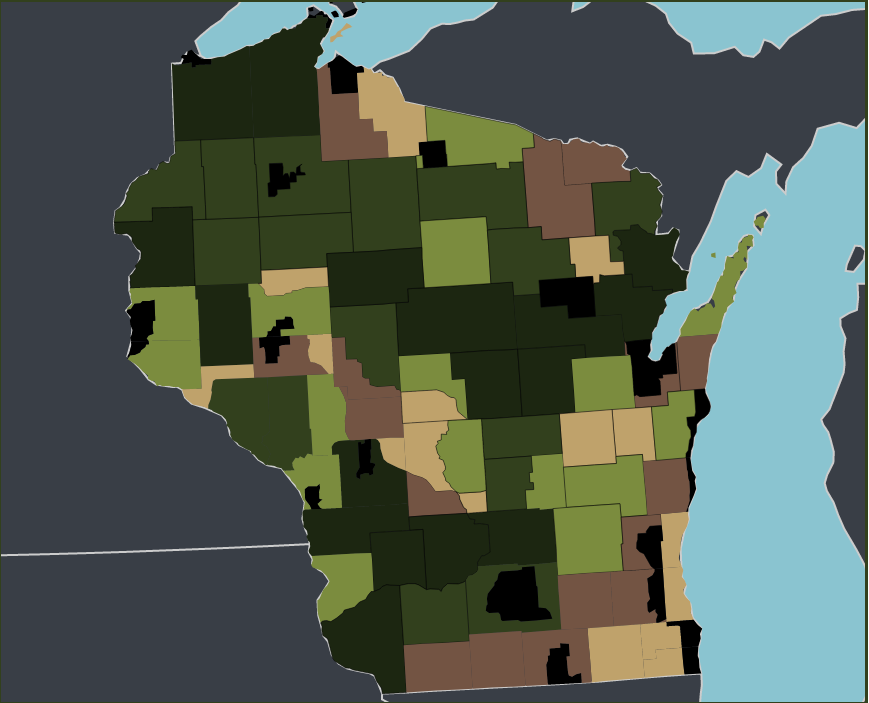
A map and bar chart of the estimated deer population of Wisconsin in 2019. D3 JS, jQuery, topojson.
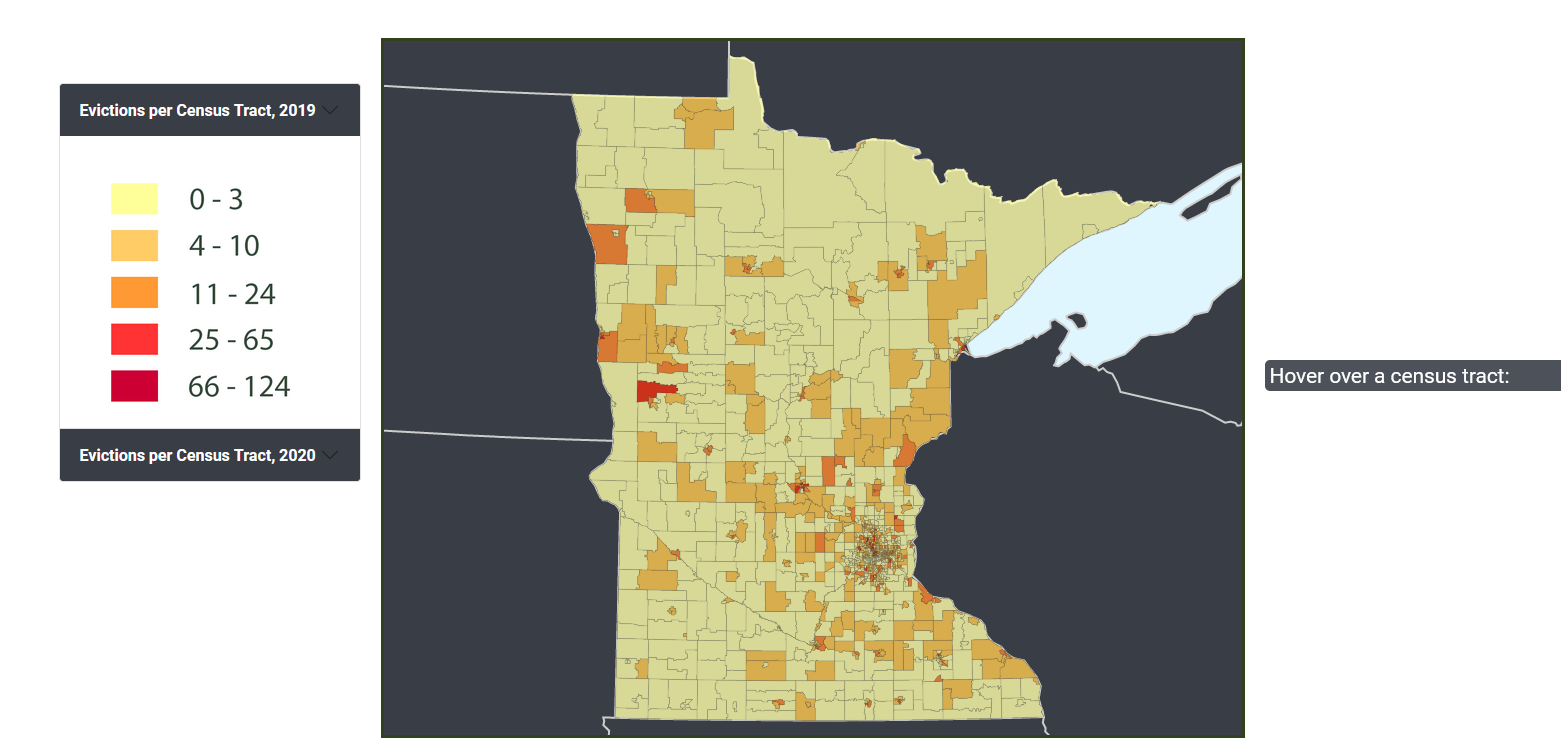
An interactive infographic comparing eviction rates in Minnesota between 2019 and 2020, after the state-ordered eviction moratorium was in place.
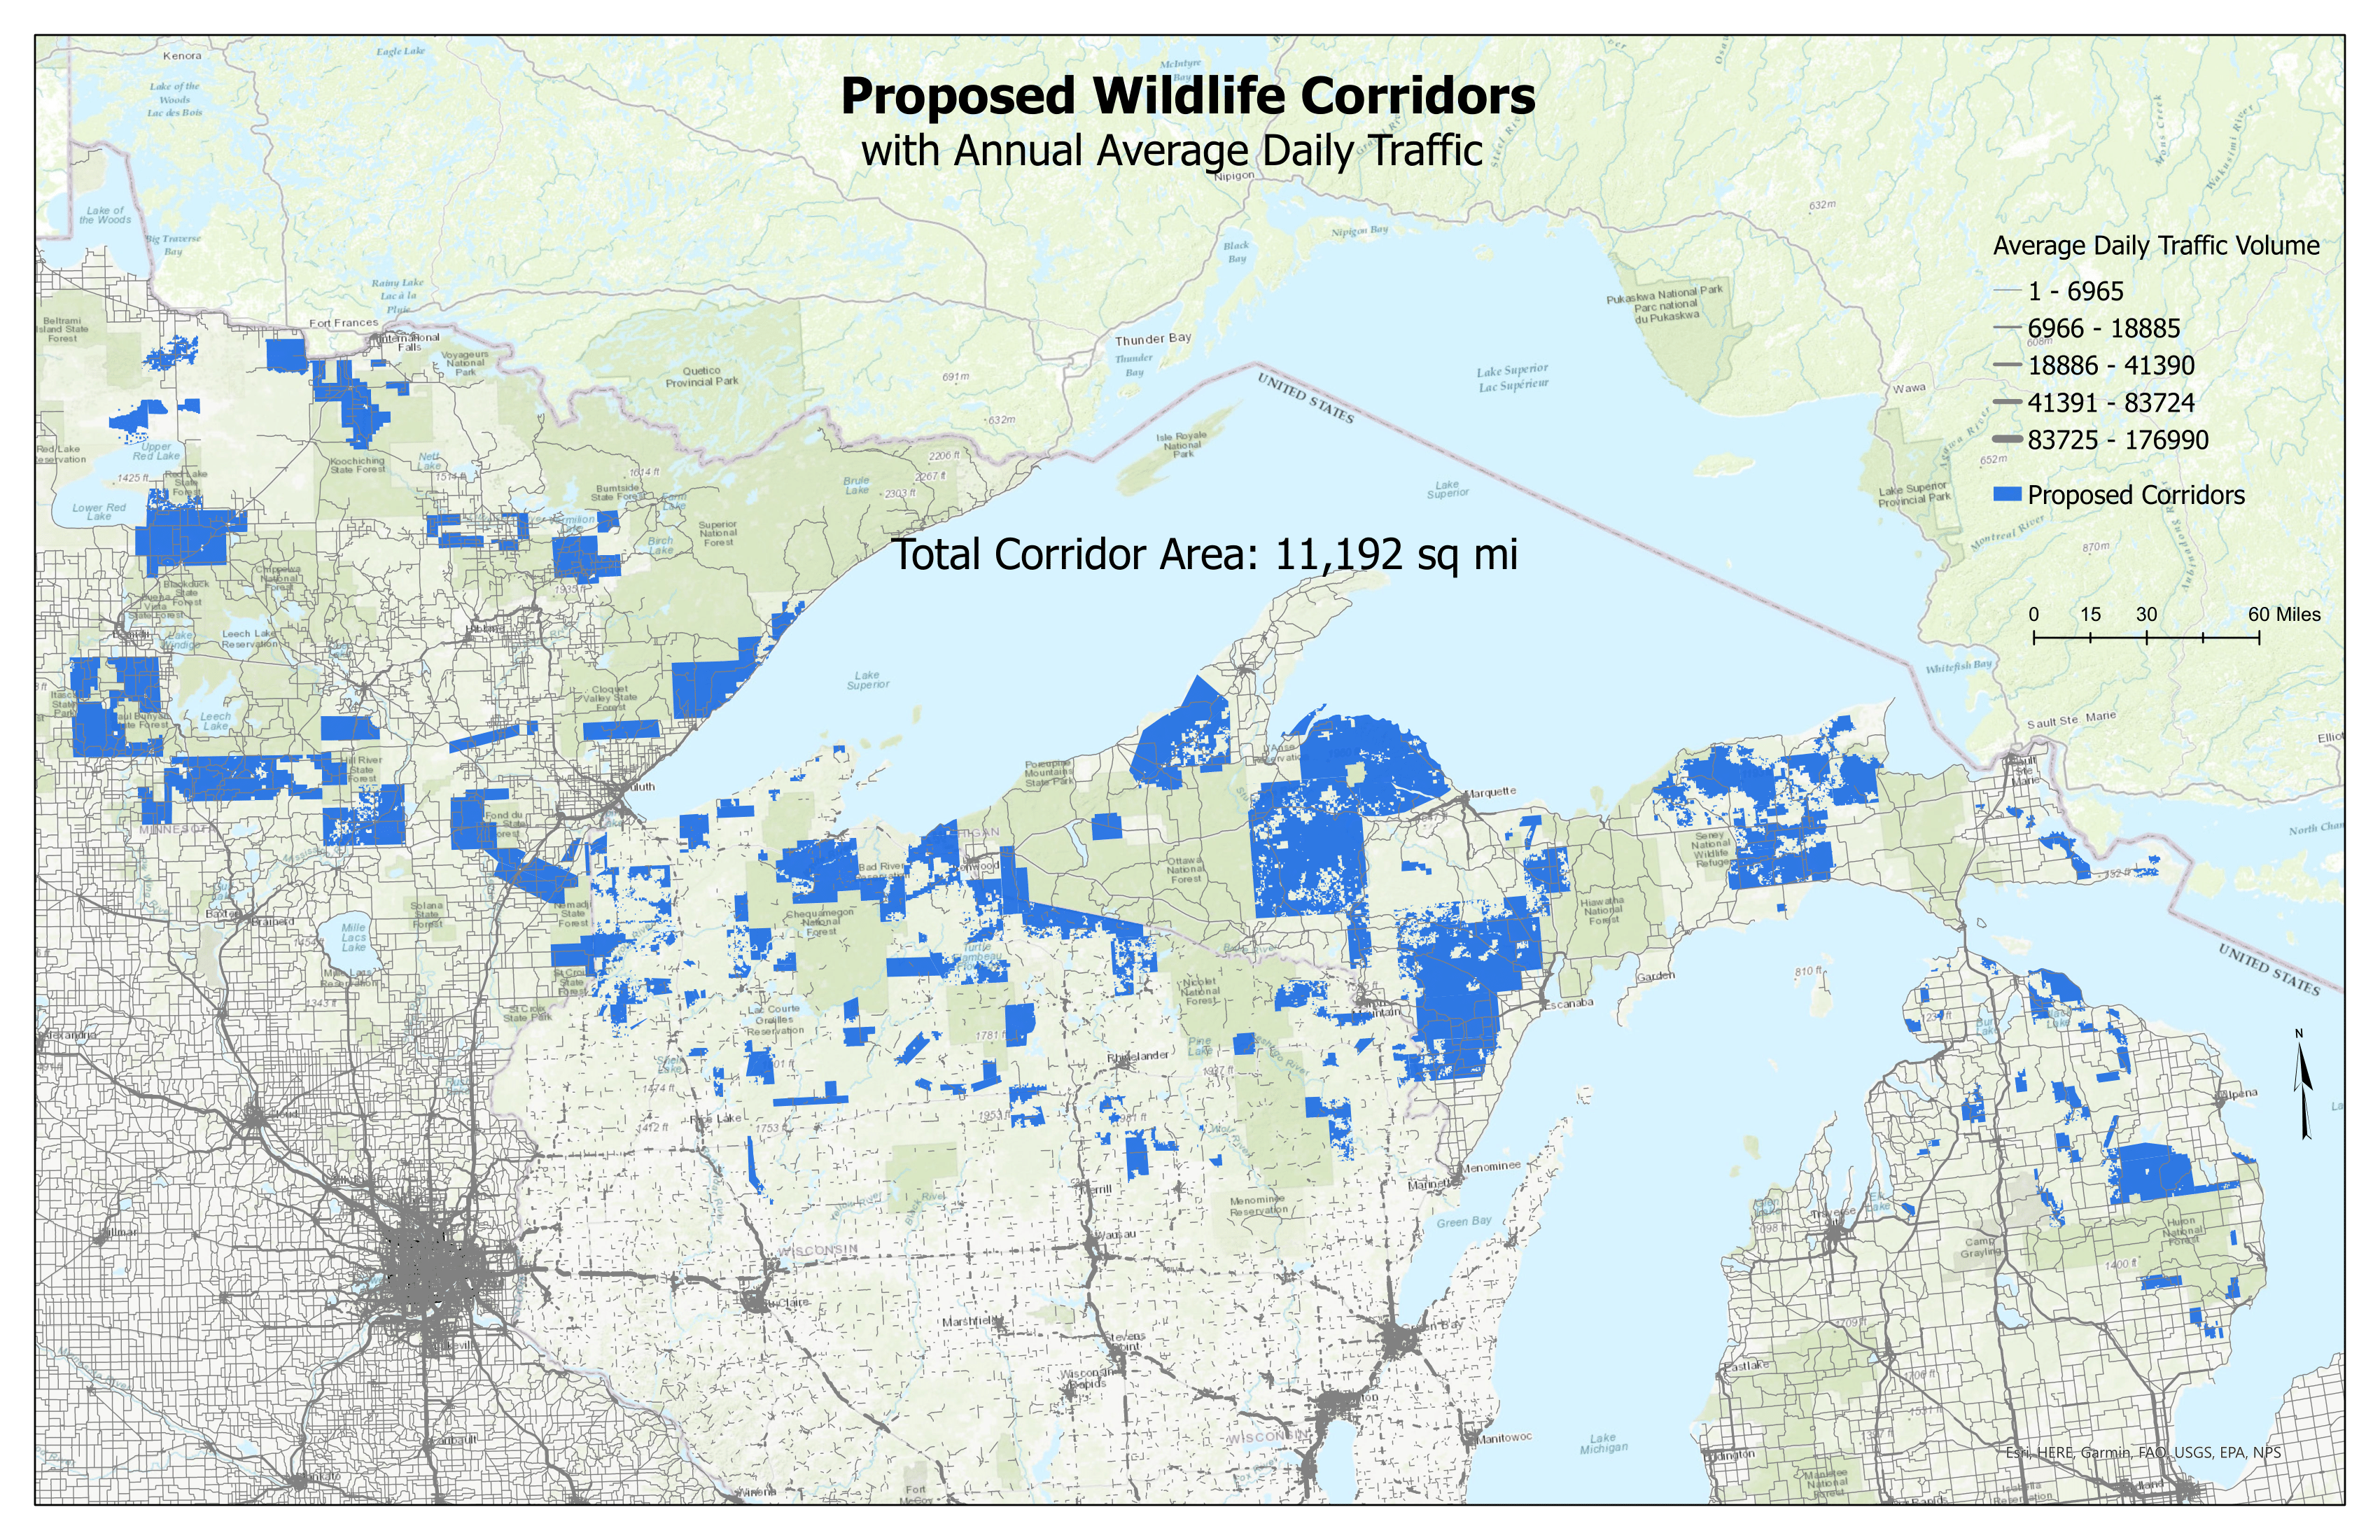
A map of proposed wildlife corridors in the Lake Superior bio-region, with annual average daily traffic counts.
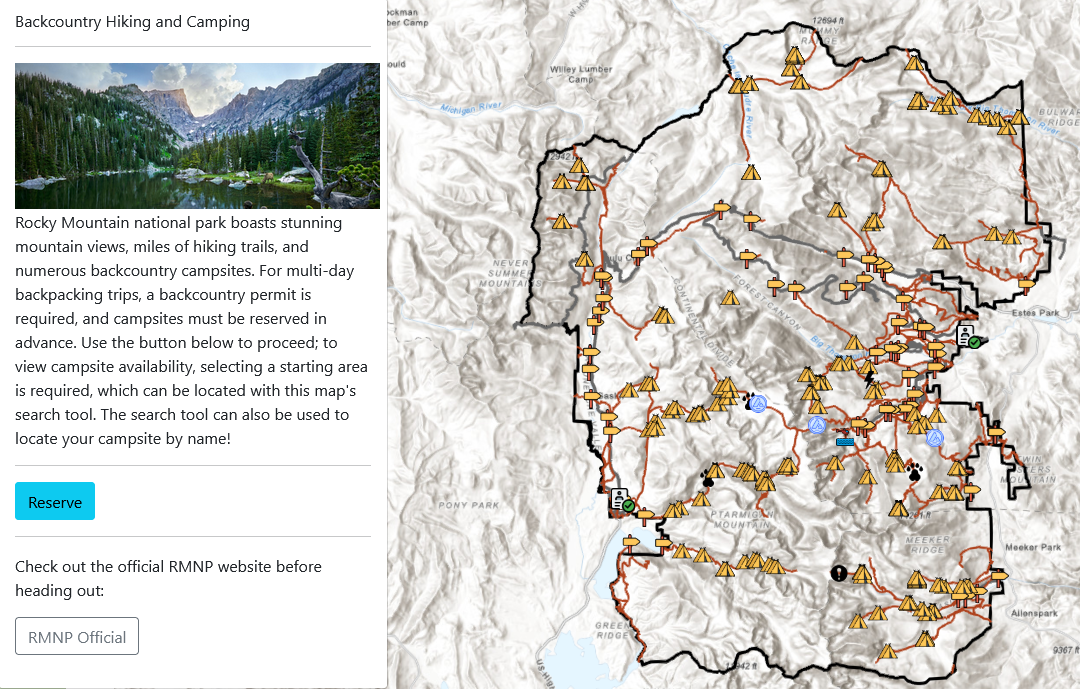
An application to assist in the planning of backcountry camping trips in Rocky Mountain National Park. Created with the ArcGIS JavaScript API.
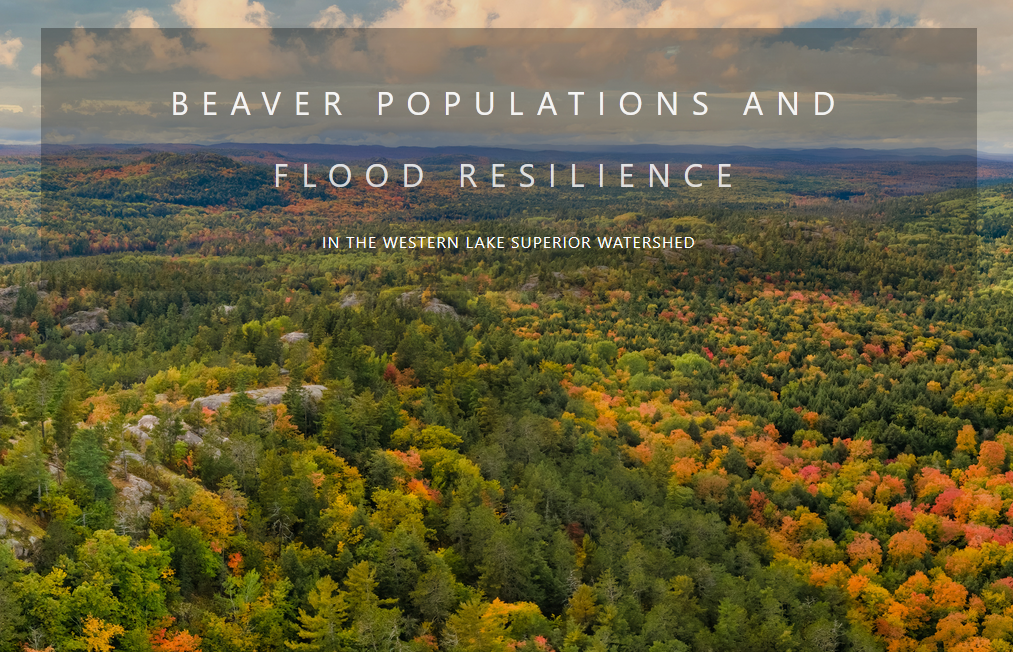
An interactive story map on the benefits of having beaver colonies present in streams, featuring maps allowing the exploration of land cover and stream data to predict where beaver colonies may be located. Created with the ArcGIS JavaScript API.
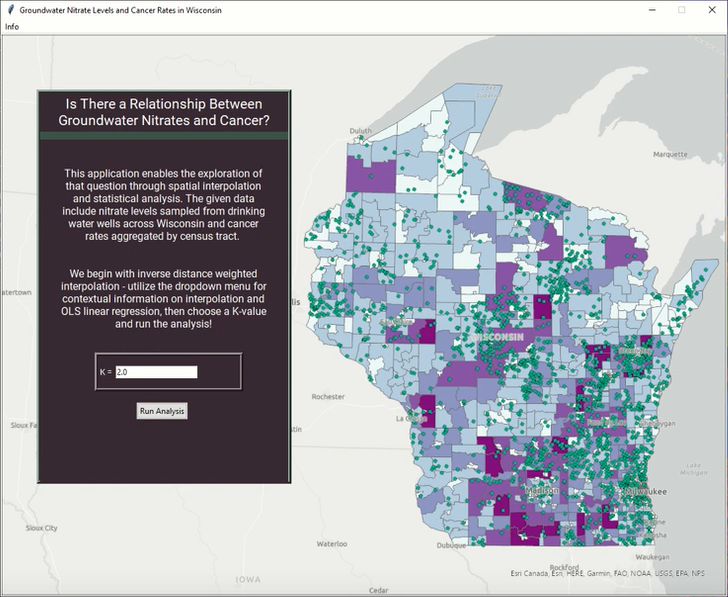
Explore the repository for a map-generating interface created with the Python TKinter library, ArcPy, and ArcGIS Pro which simulates a spatial analysis workflow to determine the extent to which groundwater nitrates are linked to cancer rates in the state of Wisconsin.